Apply MACD Indicator
This is a trend-following dynamic indicator that shows the correlation between two moving averages, generally a 26-period and 12-period SMA or WMA or EMA. You can modify the period length when you create the study. To help illustrate opportunity, a 9-period EMA "signal line" is plotted on top of the MACD.
The MACD and signal line are plotted using the following calculations:
MACD = MA(CLOSE, 12)-MA(CLOSE, 26)
SIGNAL = EMA(MACD, 9)
MACD Histogram/OSMA = MACD - SIGNAL
Where:
MA — Simple or Weighted or Exponential Moving Average;
SIGNAL — the signal line of the indicator.
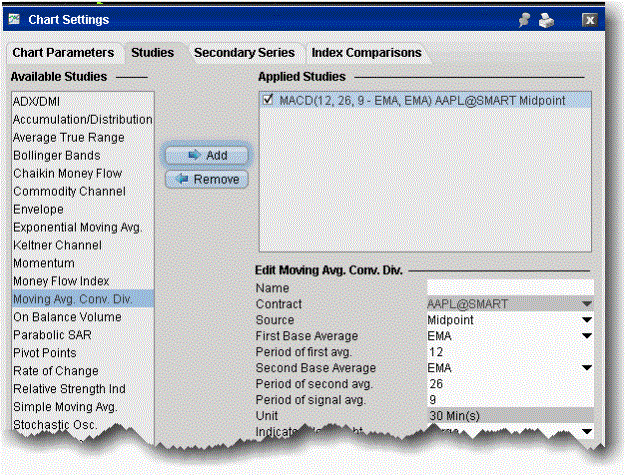
To apply a Moving Average Convergence/Divergence Indicator
- From within a chart, from the Edit menu select Studies.
- Choose Moving Avg Conv Div and Add the study.
- Complete parameters as necessary.